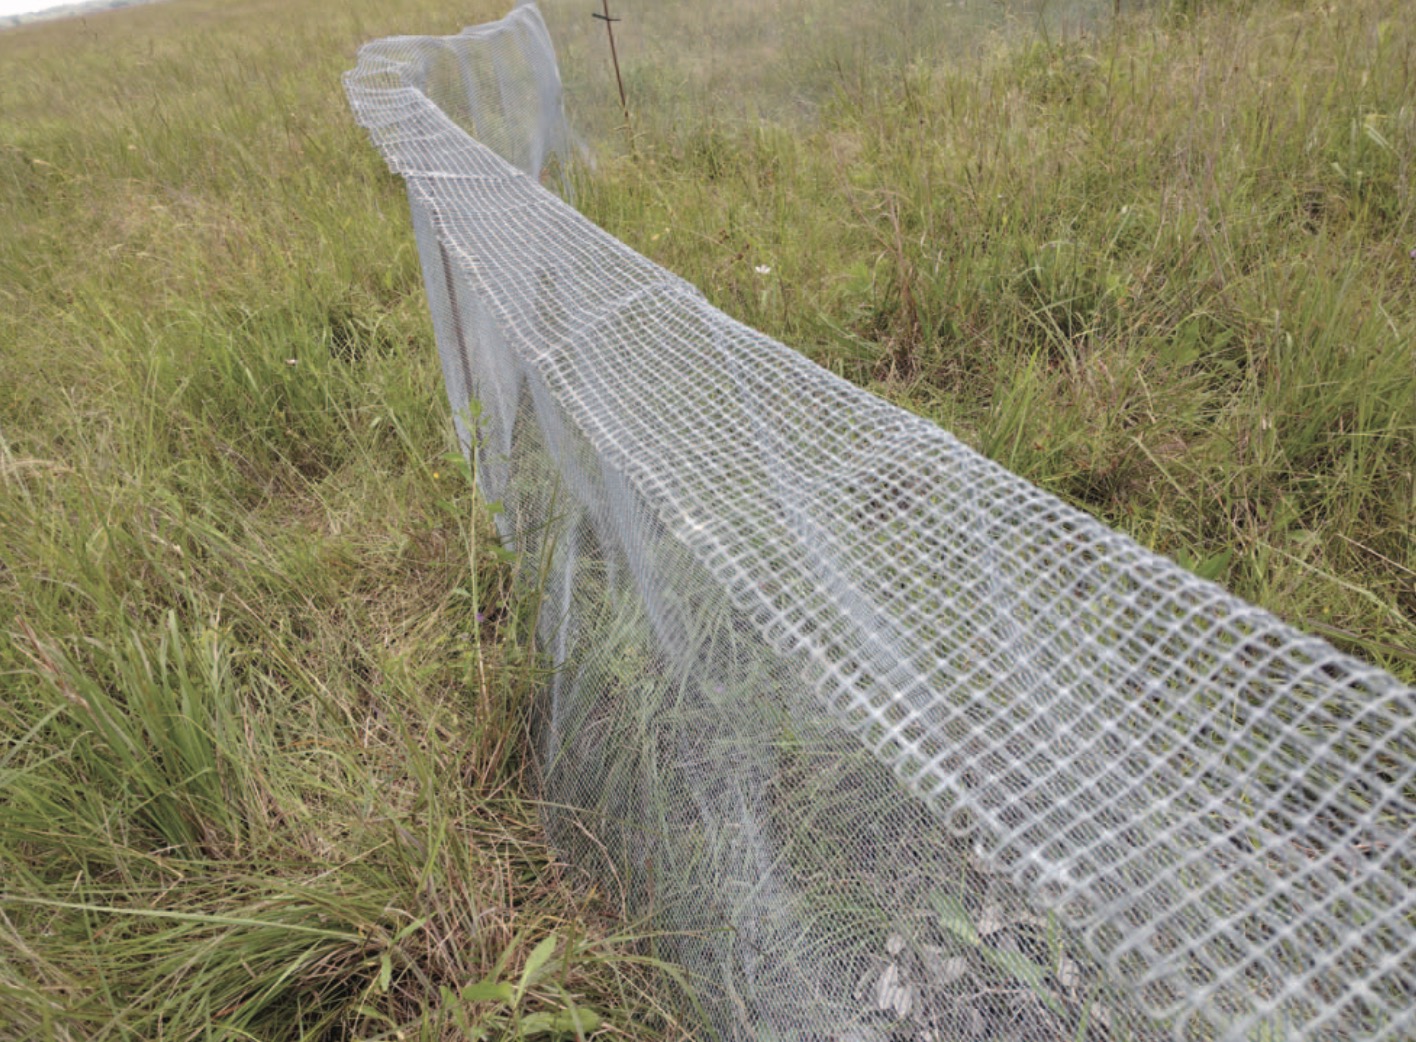
Morrow, M. E., & Toepfer, J. E. (2020). Use of predator-deterrent fences to increase Attwater's prairie-chicken nest success. Journal of Fish and Wildlife Management, 11(2), 455–462.
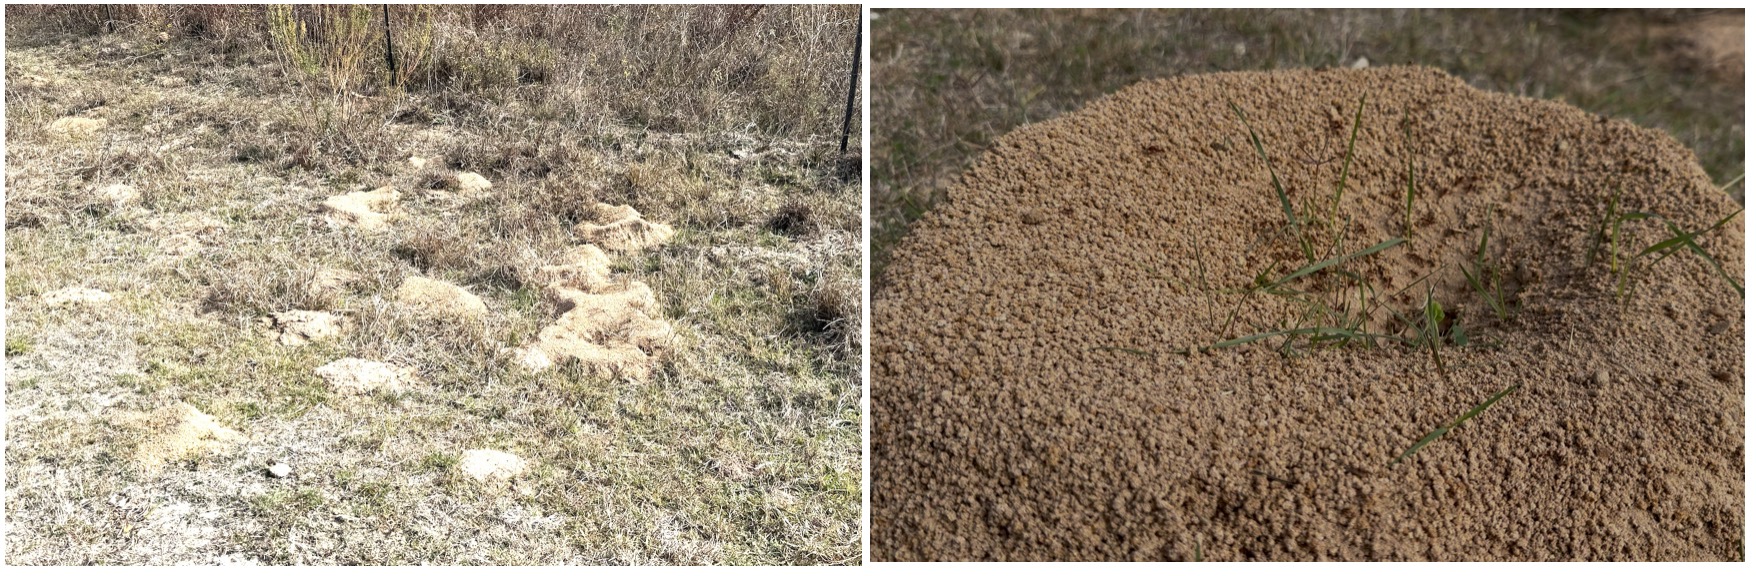
Morrow, M. E., Chester, R. E., Lehnen, S. E., Drees, B. M., & Toepfer, J. E. (2015). Indirect effects of red imported fire ants on Attwater's prairie-chicken brood survival. The Journal of Wildlife Management, 79(6), 898–906.
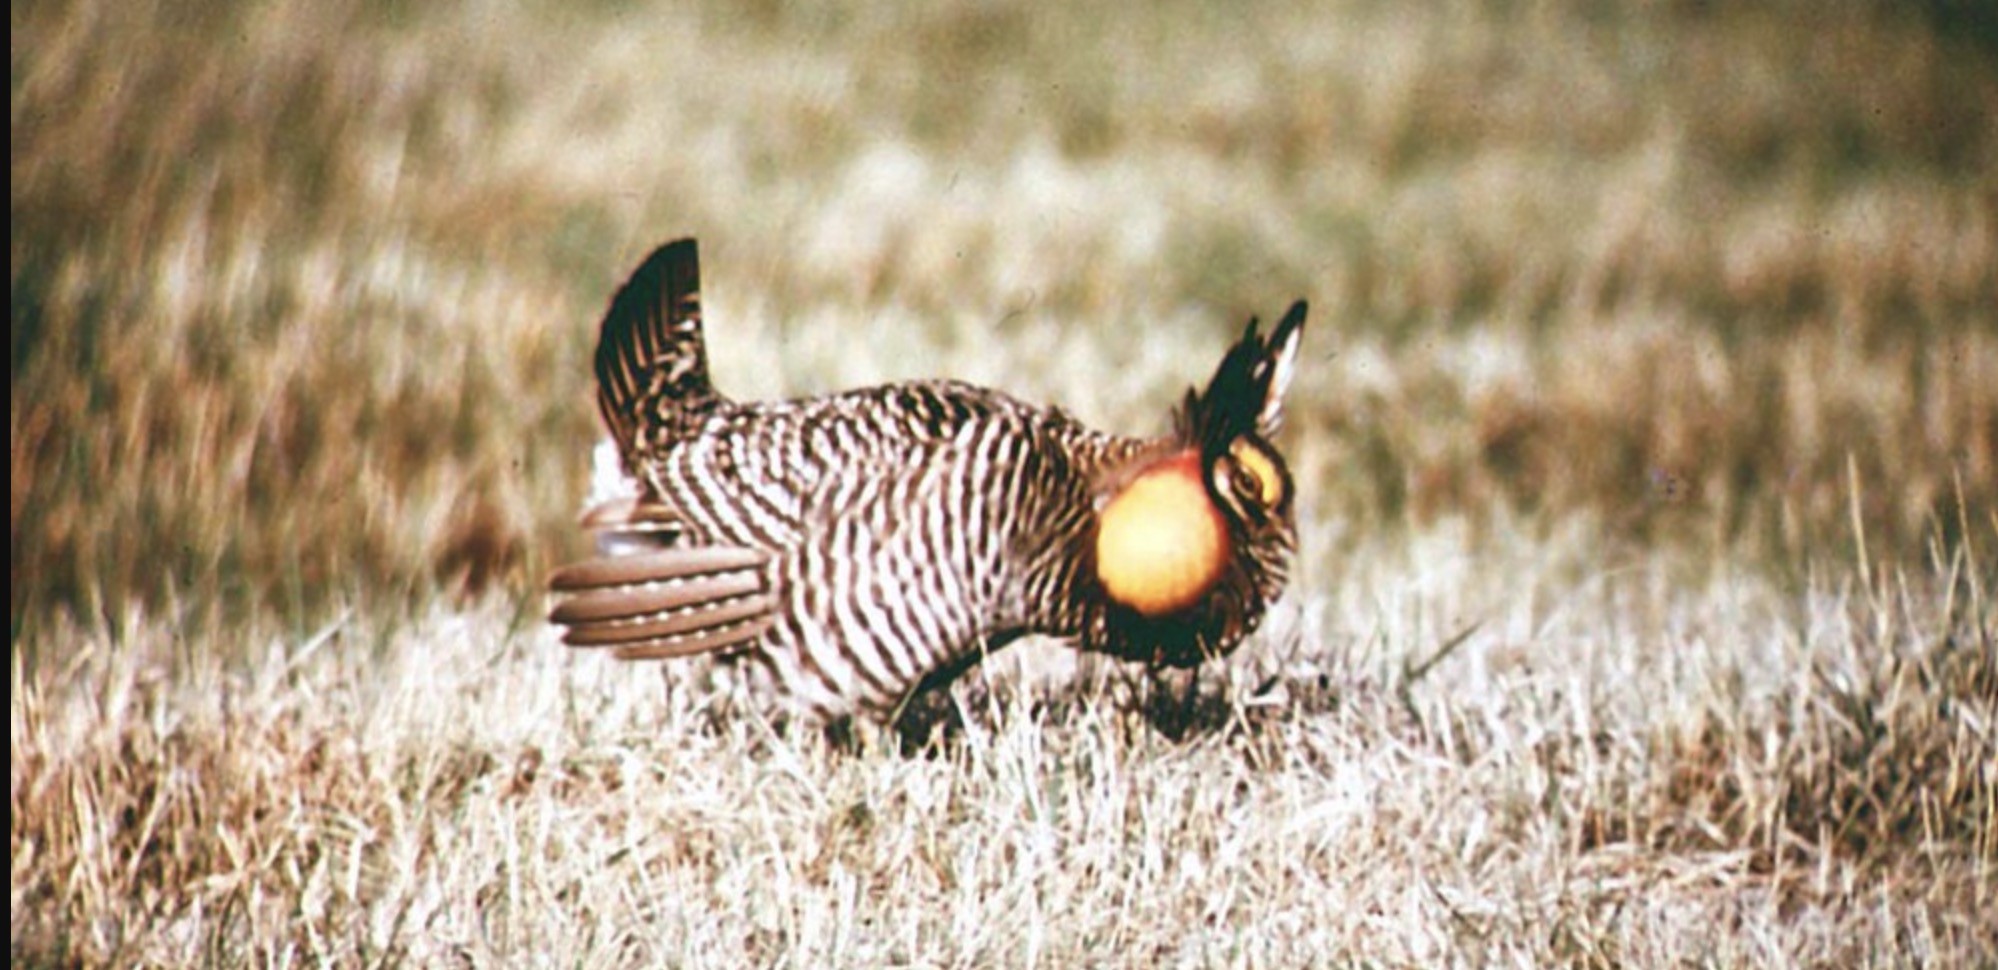
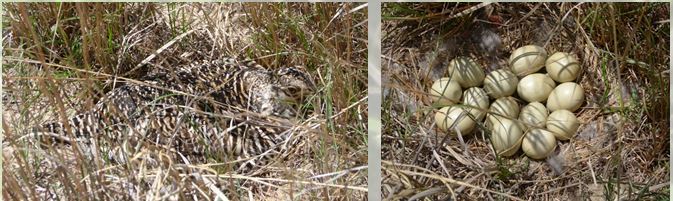
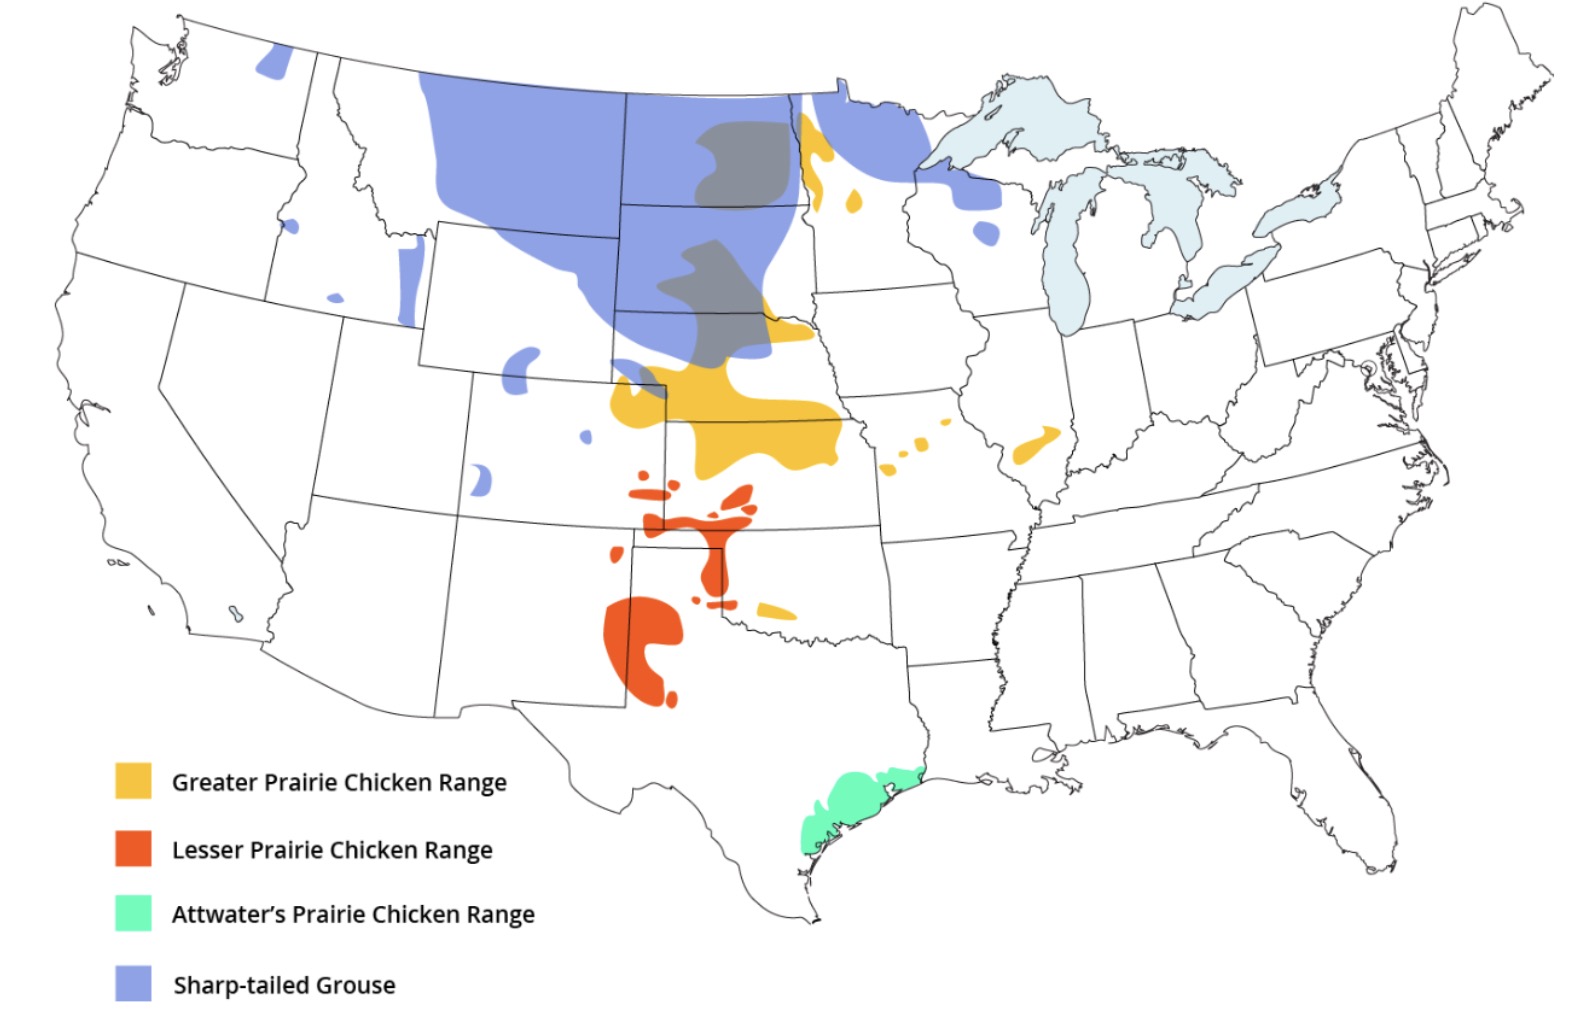
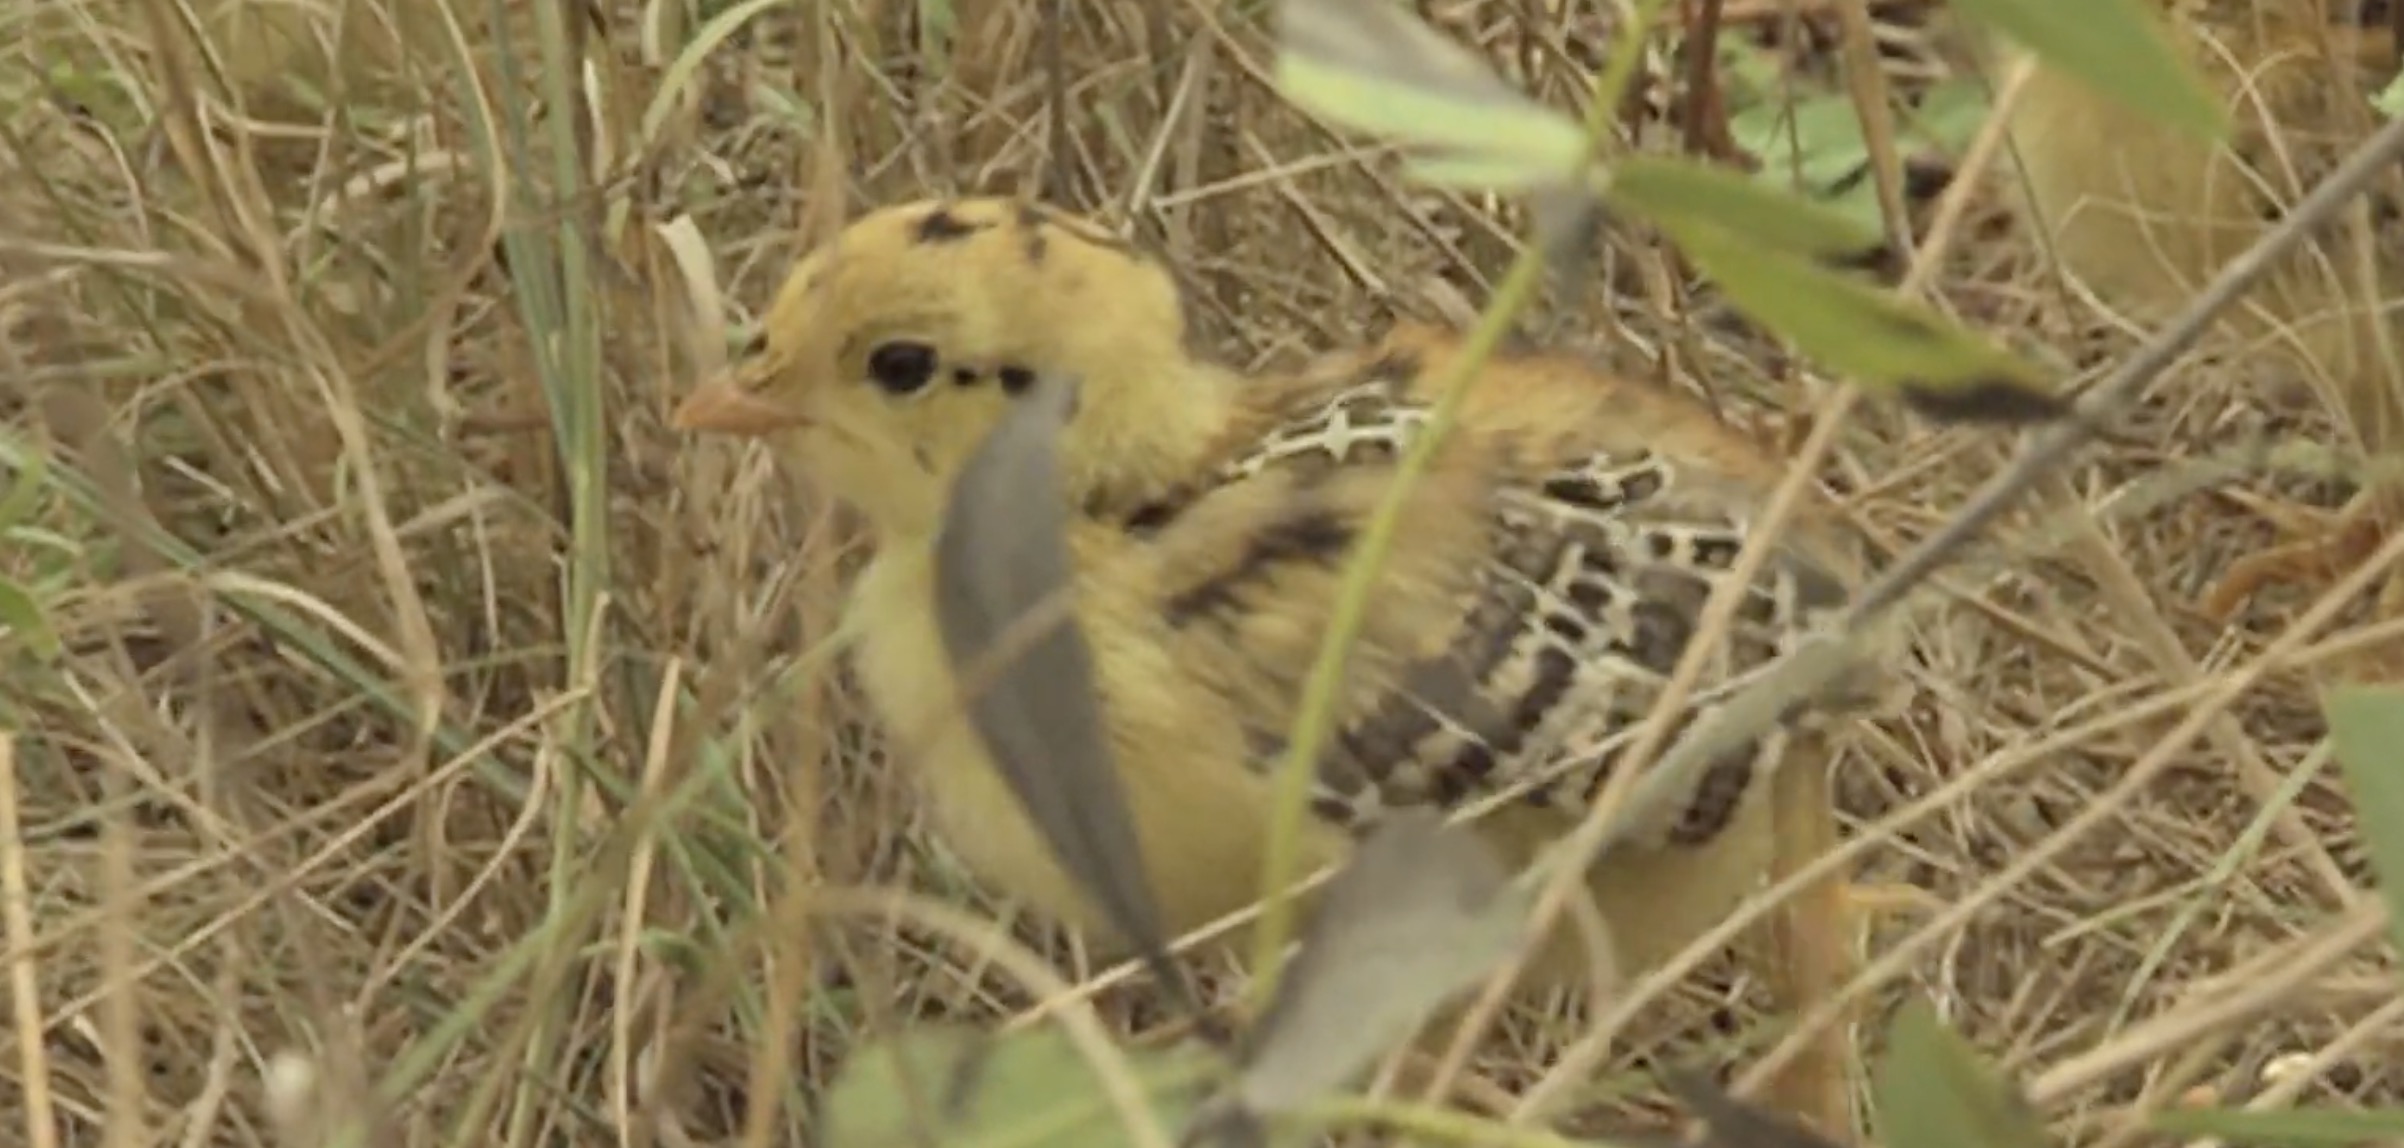
Peterson, M. J., & Silvy, N. J. (1996). Reproductive stages limiting productivity of the endangered Attwater's prairie chicken. Conservation Biology, 10(4), 1264–1276.
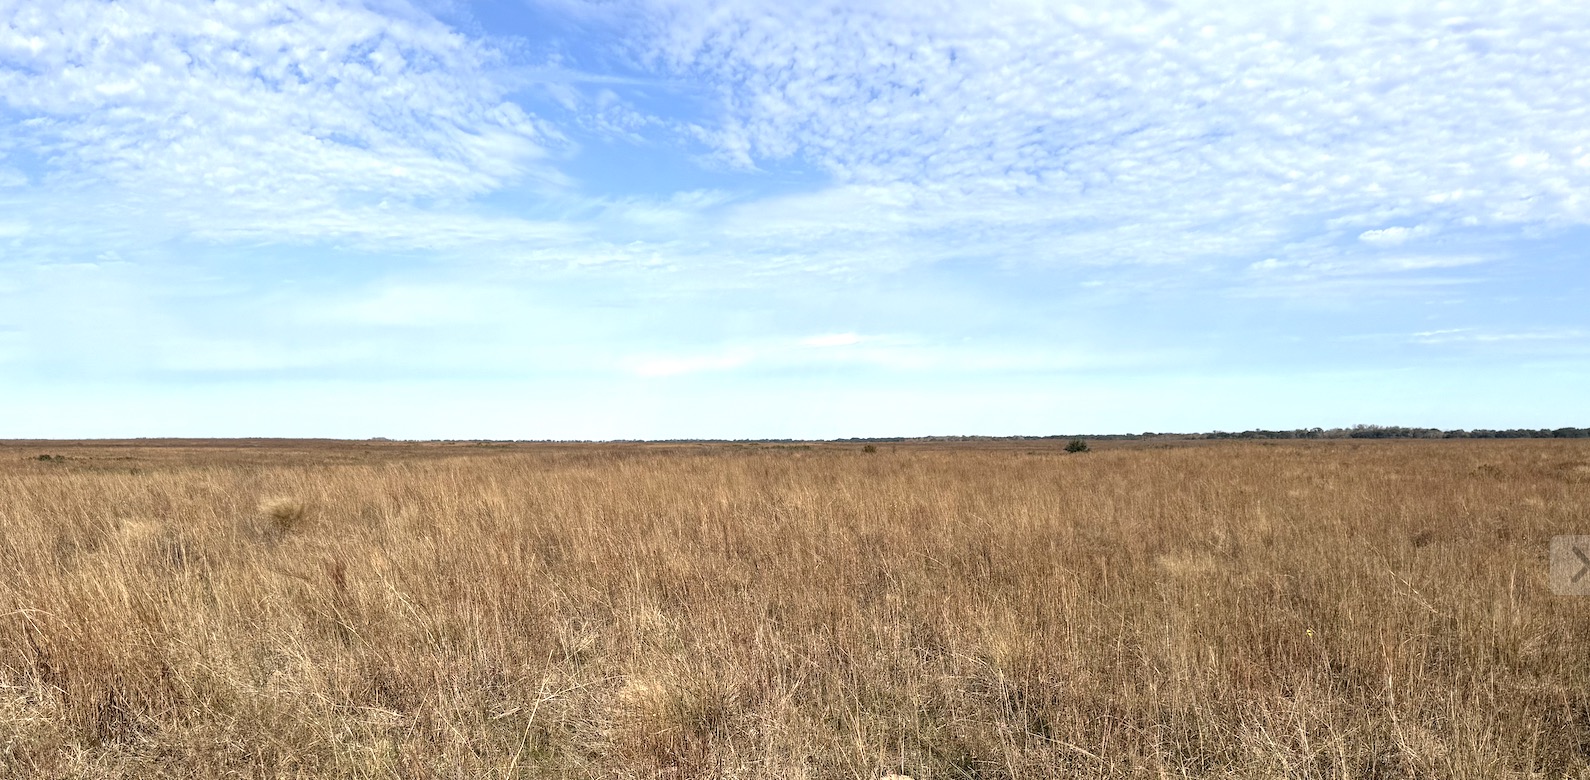
Lehmann, V. W. (1941). Attwater's prairie chicken: Its life history and management. North American Fauna No. 57. U.S. Fish and Wildlife Service.
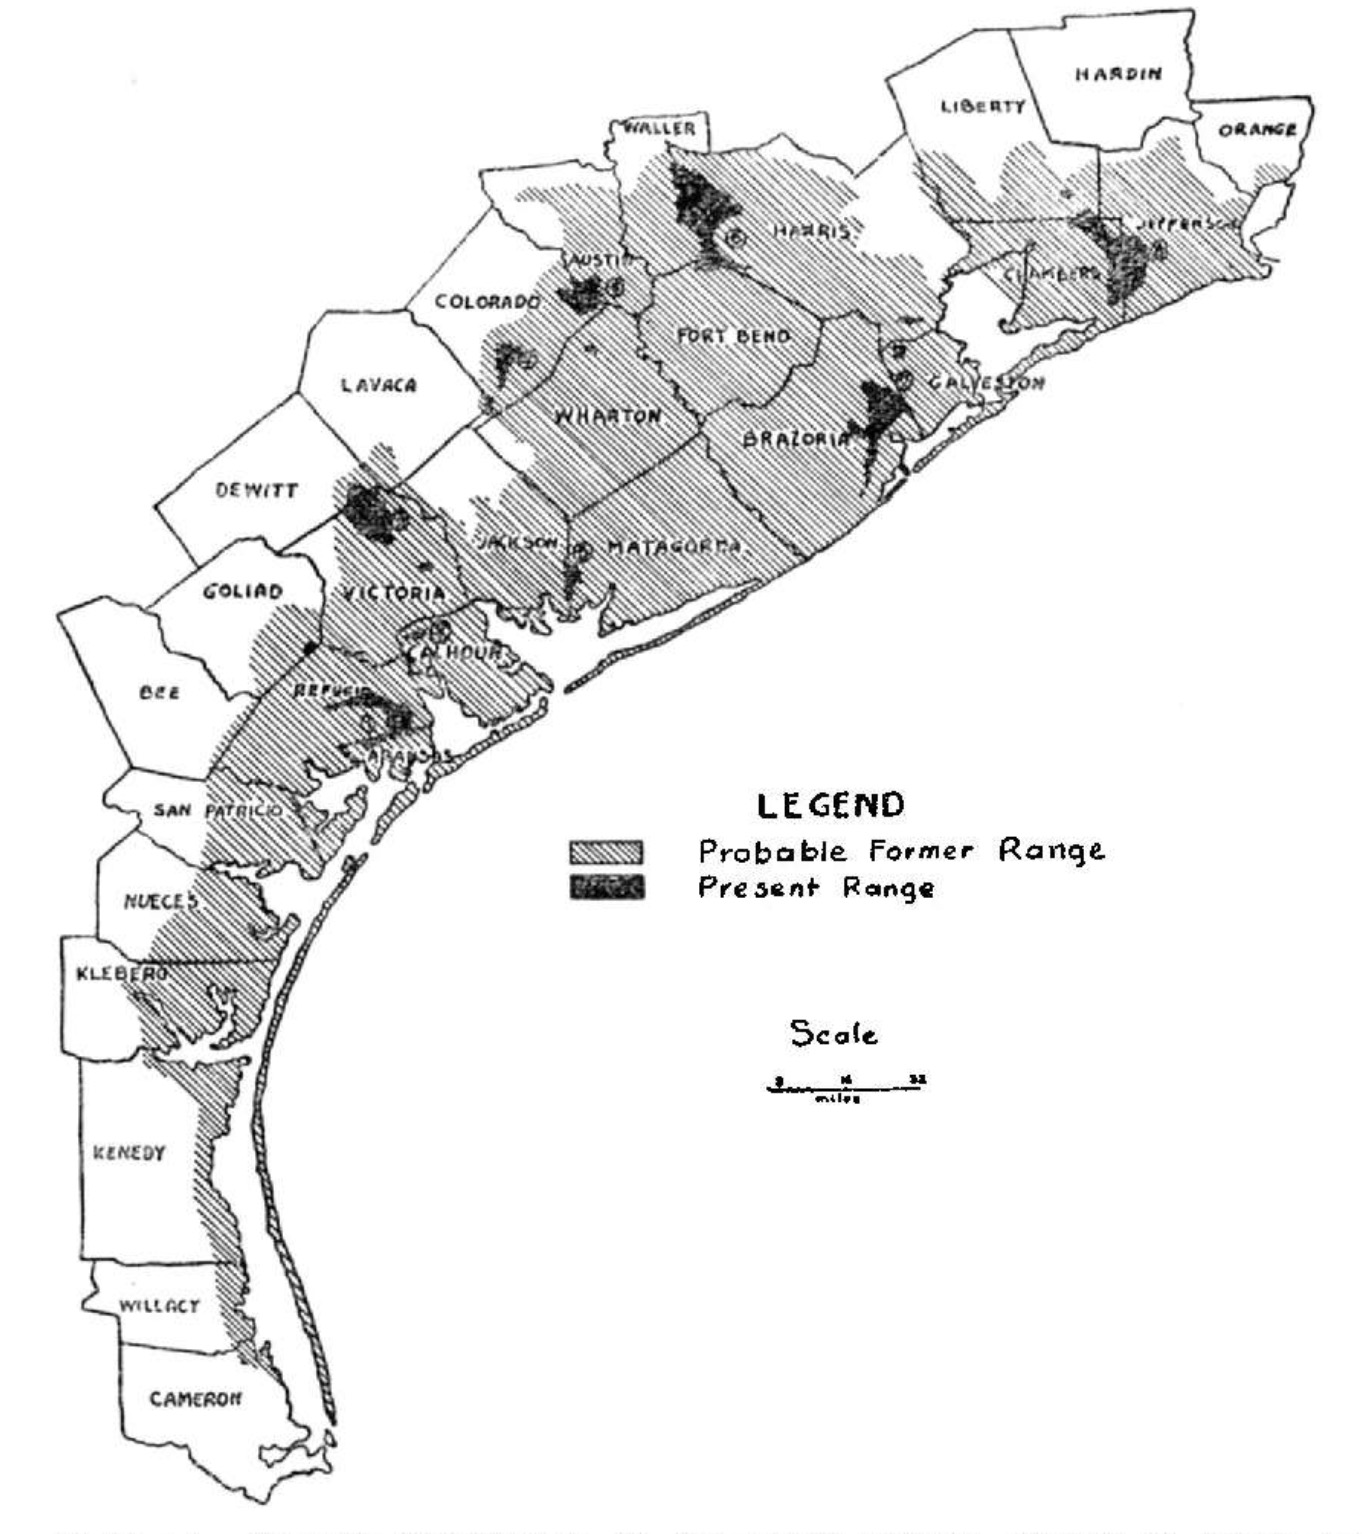
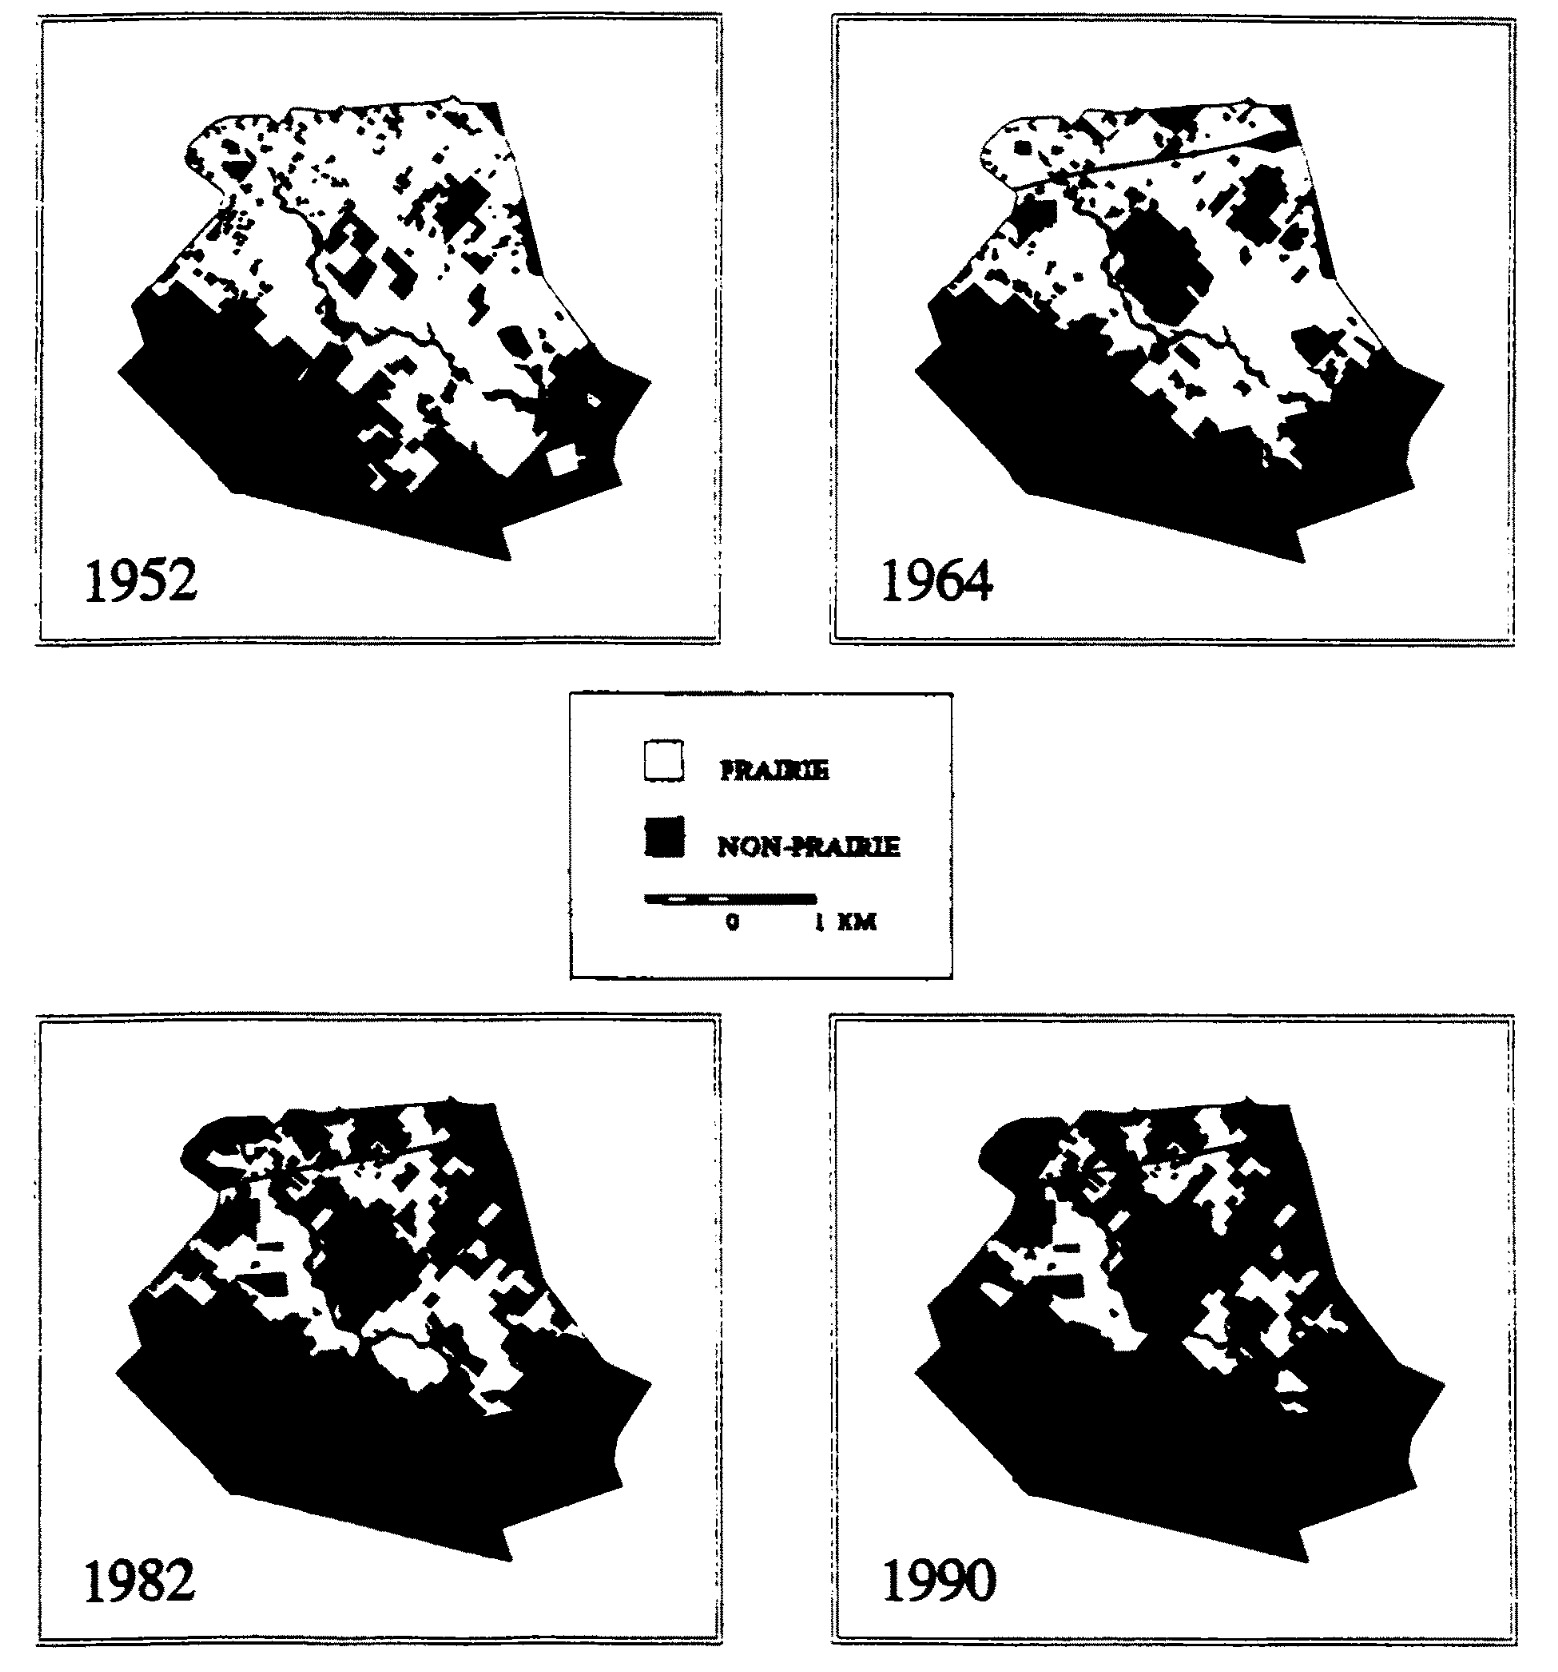
Morrow, M. E., Adamcik, R. S., Friday, J. D., & McKinney, L. B. (1996). Factors affecting Attwater's prairie-chicken decline on the Attwater Prairie Chicken National Wildlife Refuge. Wildlife Society Bulletin, 24(4), 593–601.